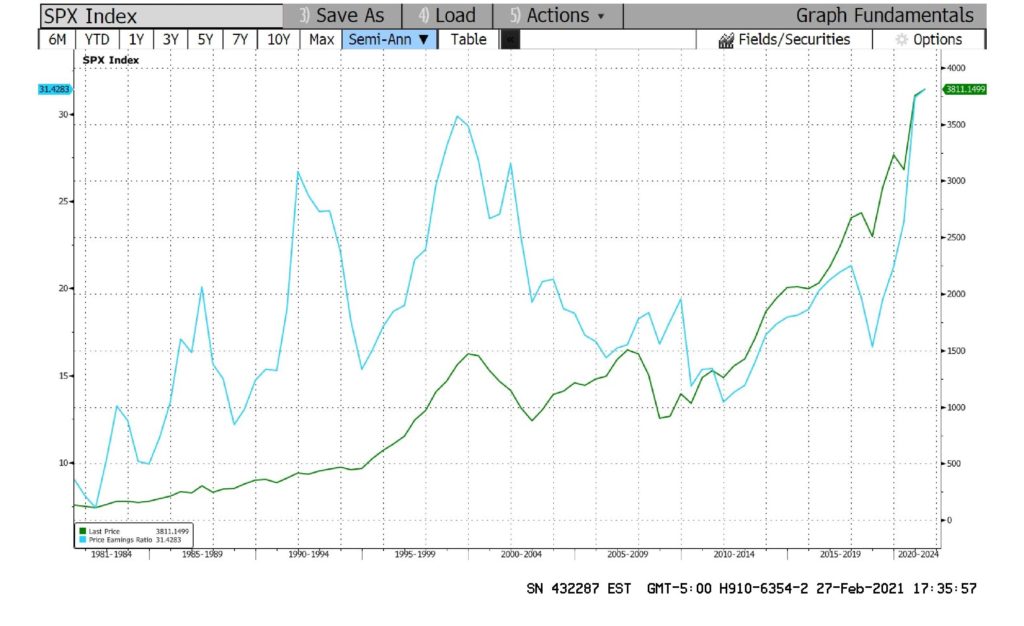
The chart shows the S&P 500 index is trading at historically a very high price-to-earnings ratio. But the party is not necessarily over. The chart also shows that a very high PE ratio can last for several years before floating back to earth.
S&P 500 = green line, PE ratio = blue line
DISCLAIMER: The information in this article is issued by Sorbie Bornholm for information only. It does not constitute a communication by Sorbie Bornholm, or any associate of Sorbie Bornholm, or an invitation or inducement to engage in an investment, nor is it a solicitation to buy or sell any investment or an agreement by Sorbie Bornholm to enter into any contract or agreement. See Terms of Use.